LAK23-causal-modelling
Causal Modelling Workshop - LAK23
Ben Hicks and Joshua Weidlich
Overview
This workshop will presented at the Learning Analytics and Knowledge conference for 2023, in Arlington, Texas, USA.
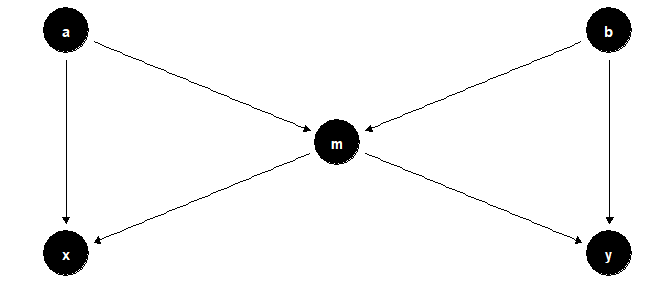
We will explore how drawing diagrams such as the one below, called DAGs, can help understand causality and potential sources of bias (the DAG below is known as the ‘butterfly bias’).
How can Causal Models help minimise bias?
Causal Models help encode our scientific assumptions in a formalised way. This graphical formalisation, the causal Directed Acyclic Graph (DAG), is both easy to interpret by non-technical experts and directly translatable to statistical modellers. By leveraging the rigorous mathematical machinery underneath the DAG (see Pearl and McKenzie, or Rohrer, Lubke et al., for a good introduction) we can build a statistical model that is designed to minimise bias in the system, based on our clearly articulated assumptions, in order to make a causal estimate.
For a deeper introduction to causal models and bias, see:
Weidlich, J., Gašević, D., & Drachsler, H. (2022). Causal Inference and Bias in Learning Analytics: A Primer on Pitfalls Using Directed Acyclic Graphs. Journal of Learning Analytics, 9(3), 183-199.
How can Causal Models help in the co design of LA?
These models are drawn, using pen and paper or online tools such as Dagitty, and are much easier to interpret for the non-technical expert than a statistical model. As such they provide an opportunity to include non-technical experts in the design process of LA and other research.
For a deeper introduction to causal models as a participatory design tool, see:
Hicks, B., Kitto, K., Payne, L., & Buckingham Shum, S. (2022, March). Thinking with causal models: A visual formalism for collaboratively crafting assumptions. In LAK22: 12th International Learning Analytics and Knowledge Conference (pp. 250-259).
What will I learn?
- Enough theoretical background knowledge to draw your own DAG
- General tips for constructing causal models
- Overview of available tools to help with causal modelling and inference
About us
Ben Hicks is a doctoral researcher with the Connected Intelligence Centre (UTS:CIC) at the University of Technology Sydney. His research centres around the participatory and scrutable modelling of learning systems, primarily using graphical causal models as a tool for engagement and collaboration. Ben has worked as a teacher for over a decade across three continents before switching to building models and data pipelines to assist in student support and retention.
Joshua Weidlich → twitter, blog
Joshua Weidlich is a postdoctoral researcher in the Educational Technologies Group at DIPF. An educational researcher by training, his research interests are at the intersection of education, technology, and psychology. He received his doctorate on the topic of social presence in online distance learning environment in 2021 from the FernUniverstität in Hagen, the largest German distance education university. He has worked as research staff at the Department of Instructional Technology & Media at FernUniversität in Hagen as well as the Department of Technology-Enhanced Learning at Heidelberg University of Education. In 2022, he received the Outstanding Dissertation Award by the Deutsche Gesellschaft für Hochschuldidaktik. He is part of an international emerging field group (EFG, part of EARLI) on social presence and telepresence in online learning. He maintains a curated list of Open Access journals in Educational Technology.
Preparation
The workshop is designed to allow for two streams: those interested in a general introduction into causal modelling and applications using pen and paper, and those also interested in the coding of the models, primarily using R. Pen and paper is fine, there is no need to delve into the code unless this is already an area of interest. Some of the benefits of using software packages are also available in a web based graphical tool called Dagitty, which will also be covered.
Optional: Think of a problem
Do you have a problem in your research or work where it would help to understand a causal effect? It may be an intervention that has been performed, or perhaps proposed, whose impact is difficult to untangle from other parts of the learning system (LA examples are available in both our papers, outlined below in Further reading). If you can think of a problem, bring it along to the session for a chance to work collaboratively on minimising the bias in estimating the causal effect through the development of a causal model.
Optional: Further reading
We have already shamelessly plugged our papers, but here they are again: Thinking with causal models and Causal Inference and Bias in Learning Analytics. The Book of Why is a very readable introduction to the use of graphical causal models and why they are important for science.
Very very optional: R installation and packages
If you are interested in following some of the code examples we may cover, then make sure you have R (and preferably RStudio) installed prior to the workshop. The following code will install the required packages:
install.packages("tidyverse")
install.packages("dagitty")